VIDALINA ABADAM, ANDREW SOWELL, SETH WECHSLER, ANGELICA WILLIAMS AND JENNIFER BOND
USDA
U.S. Rice Stocks Are Raised On Lower Use Forecast
The U.S. all-rice ending stocks projection for 2025/26 increased 5 million hundredweight (cwt) to 55.3 million this month, the highest since 1985/86. Increases in forecasted rice stocks were driven by decreases for long grain rice exports and domestic use and residual. Long-grain rice exports decreased 3 million cwt to 51 million due to continued slow sales and fewer shipments than previously forecast to Western Hemisphere markets. Long-grain rice domestic use and residual decreased 2.0 million cwt to 137.0 million based primarily on the USDA, National Agricultural Statistics Service (NASS) March 31 Rice Stocks report, which indicated less December−February disappearance than previously estimated. The 2025/26 season-average farm price (SAFP) for all rice is unchanged at $12.10 per cwt.
Domestic Outlook
Growers Report Sharp Reductions in Rice Plantings for 2026/27
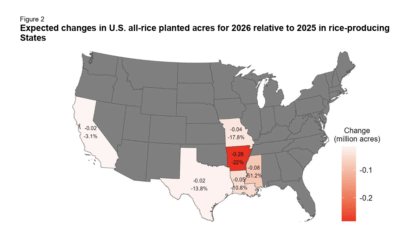
On March 31, 2026, USDA, NASS released its annual Prospective Plantings report. This report provides the first survey-based indication of 2026 acreage expectations for a wide variety of crops, including rice. Based on a survey conducted during the first two weeks of March, U.S. rice growers intend to plant 2.319 million acres of rice in 2026, about 18 percent fewer acres than in 2025. (figure 2).
Acreage declines are the largest for long-grain rice, which dropped 22 percent from 2025 to 1.648 million acres, the lowest since 1983. Area sown to medium- and short-grain rice is also forecast lower with 2026 plantings projected at 97 percent of the prior year estimates.
Arkansas, the largest rice-producing State, leads the reduction in long-grain rice acreage, dropping 280,000 acres from 2025 to 900,000 acres, the lowest since 1987. For medium- and short-grain rice, the biggest reduction is for California, the second largest producer, where area is expected to be down 15,000 acres to 500,000. Relatively low prices, particularly for long-grain rice, and high input costs, especially for fertilizer and diesel, are factors likely considered in farmers’ decisions to cut rice plantings in the new marketing year.
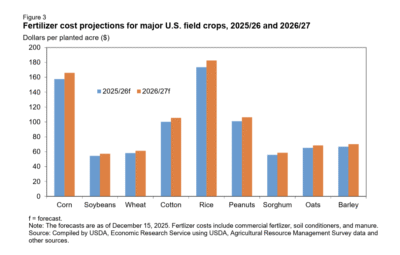
USDA, Economic Research Service’s latest cost of production forecast reveals that in 2025 rice producers faced the highest fertilizer costs per acre among major field crops at $173.50. For 2026, fertilizer costs for rice are projected higher at $182.60 per acre, exceeding costs for corn – the crop with the second-highest fertilizer expenses – by nearly $17 per acre. (figure 3).
For the week ending April 5, 30 percent of the U.S. rice crop was reported planted, ahead of both a year earlier and the U.S. 5-year average. Planting was ahead of normal in all reported southern States and close to completion in Louisiana and 50 percent completed in Texas. Planting does not typically begin in California until late April. However, an unseasonably dry weather (reported in the April 7 U.S. Drought Monitor report) is beginning to become an issue as it has been delaying new-crop plantings in some areas. For the week ending April 5, emergence in Arkansas, Louisiana, and Mississippi were ahead of the 5-year average, while Texas is tracking recent years’ pace.
All-Rice Domestic and Residual Use Lowered
The 2025/26 U.S. total domestic demand and residual use forecast decreased 2.0 million cwt to 169.0 million, though the implied usage remains a record. Decreases in demand for long-grain rice account for all the downward revision. These reductions could have been more pronounced, but below average milling yields likely bolstered domestic millers’ rough rice utilization. Use adjustments are based on implied disappearance from August−February as indicated by the March 1 stocks reported in the USDA, NASS Rice Stocks report, and on exports based on trade data through February from the U.S. Department of Commerce, Bureau of the Census.
U.S. stocks of rough rice on March 1, 2026, are estimated at 104 million cwt, up 3 percent from the year prior. Long-grain rice accounted for 67 percent of total rough rice stocks while medium-grain accounted for 32 percent and short-grain for the remaining 1-percent. The majority of rough rice stocks (55.0 million cwt or 53 percent) were held in Arkansas on March 1, 2026. California held about 29 percent or 30 million cwt of U.S. rough rice stocks on the same date. Stocks of milled rice held in all positions on March 1 totaled 7.7 million cwt, up 23 percent from 2025. As such, all-rice carryout for 2025/26 is elevated to a 40-year-high of 55.283 million cwt this month.
All-Rice Exports Trimmed
All rice exports are reduced this month by 3.0 million cwt to 82.0 million, all on long-grain, on a continuation of relatively slow sales and fewer shipments than previously forecast to Western Hemisphere markets. Rough rice exports are reduced 2 million cwt to 19 million cwt, the lowest since 2022/23, while milled rice exports are down 1 million cwt (rough rice equivalent) to 63 million cwt.
The United States continues to face strong price competition in key Latin American markets from rice exporters in South America—particularly from Brazil, Argentina, and Uruguay. Notably, U.S. shipments of all-rice to Mexico have been sharply lower during the 2025/26 marketing year, falling more than 50 percent (August−February) compared to the same period a year prior. USDA, Foreign Agricultural Service (FAS) U.S. Export Sales data indicates that accumulated exports for all varieties of U.S. long-grain rice totaled 25.8 million cwt (rough rice equivalent) as of week 35 of the current marketing year, about 33 percent lower than the 2025/26 volume over the same period.
By-Class Rice Prices Are Adjusted Following Data Updates
This month, the all-rice season average farm price (SAFP) for 2025/26 is unchanged and remains at $12.10 per cwt. A lower forecast for the 2025/26 long-grain price is completely offset by elevated projections for medium- and short-grain rice prices for Other States in the all-rice SAFP calculation. The long-grain SAFP was cut $0.10 per cwt to $10.40 this month based on lower expectations for prices in the remainder of the marketing year, largely a result of the 5- million-cwt increase in long-grain ending stocks. If realized, this will be the lowest long-grain rice SAFP since 2016/17 when farmers received $9.61 per cwt. The 2025/26 SAFP for the all medium- and short-grain rice is raised 20 cents this month to $18.30 per cwt driven by a 50-cent increase for Other States.
International Outlook
Global 2025/26 Production Increases Slightly
Global rice production in 2025/26 is projected at 541.4 million metric tons (milled basis), up 0.1 million tons from the previous forecast. This change was driven by an increase in estimated production in Thailand, where favorable weather drove a slight increase in forecasted area planted, offsetting smaller crops in Philippines and Taiwan. Estimates of production in India (152 million metric tons) and China (146 million metric tons), the world’s two largest rice producers, are unchanged from the previous forecast.
The month-to-month increases for production and beginning stocks raised estimates of 2025/26 global rice supplies to a record 732.9 million tons, 0.4 million tons higher than the previous forecast.
Projections of 2025/26 global rice consumption (including a residual component that accounts for post-harvest losses) dropped by 400,000 tons in April to 540.6 million tons. This decrease was driven by a 175,000 ton decrease in forecasted consumption in Japan, a 100,000 ton decrease in forecasted consumption in Iraq, and a 75,000 ton reduction in forecast each for Cuba, Saudi Arabia, and Taiwan. These decreases more than offset small increases elsewhere. Consumption remains at record-high levels in many major rice-consuming countries, including Bangladesh, India, Nigeria, Philippines, Thailand, Vietnam, and the United States.
Global ending stocks in 2025/26 are projected at 192.3 million tons, a 0.8-million-ton increase from the previous forecast. Upward revisions of inventories for countries including Iran, Pakistan, Japan, and Thailand more than offset reductions for countries including Bangladesh, United Arab Emirates, the Philippines, and Taiwan. China (55 percent) and India (25 percent) together continue to account for most of the global inventory, largely due to government stockholding programs.
Global Rice Trade in 2026 Remains at a Record-High
In calendar year 2026, global rice exports are expected to reach 62.1 million tons (milled basis). This month’s projection reflects a 0.4-million-ton decrease from the previous forecast, largely due to reductions for Pakistan and the United States on increased competition from lower-priced exporters. Global rice imports are down 0.3 million tons to 59.9 million tons, led by several reductions in the Middle East and Sub-Saharan Africa more than offsetting an increase in China.
Reported price quotes from sellers in major exporting nations between the weeks ending March 11, 2026 and April 8, 2026 increased for Thailand, Vietnam, Uruguay, and Argentina, but decreased for India and Pakistan. U.S. quotes for the No. 2, 4-percent brokens remained $550 per ton. Thai quotes for 100-percent Grade B increased $10 (2 percent) to $388 per ton. Five-percent brokens from Vietnam were quoted at $380 per ton, 7 percent higher than quoted prices at the beginning of March. Average quotes for 5-percent brokens from Argentina increased 20 dollars (6 percent), from $360 per ton to $380. Quotes from Uruguay for the generic 5-percent brokens increased $10 dollars (2 percent) to $480 per ton. By contrast, quotes for 5-percent brokens in India dropped $15 (4 percent) to $340 per ton, reflecting 4 consecutive months of decline, and Pakistani quotes dropped $5 (1 percent) to $345 per ton. ∆
VIDALINA ABADAM, ANDREW SOWELL, SETH WECHSLER, ANGELICA WILLIAMS AND JENNIFER BOND
USDA
Link to Original Article:chrome-extension://efaidnbmnnnibpcajpcglclefindmkaj/https://ers.usda.gov/sites/default/files/_laserfiche/outlooks/114058/RCS-26C.pdf?v=81683
We use cookies to ensure that we give you the best experience on our website. If you continue to use this site we will assume that you are happy with it.